Keys and Analytics
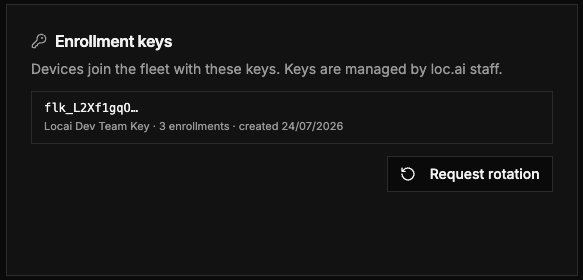
Enrollment Keys
The Enrollment & config tab shows your organisation's Enrollment keys card. This is a read-only view of your active enrollment key reference (with its enrollment count and creation date); secret key material is never displayed in the console.
If you need a key rotated, use the Request rotation button. The Locai team will action the rotation; duplicate requests are automatically deduplicated, so it is safe to submit more than once.
Enrolling devices with a fleet key
IT teams can enroll devices non-interactively with the fleet key — no interactive setup on the device. As of Link 1.3.0 there are two ways:
- Register an installed device: run
locai register --fleet-key YOUR_FLEET_KEYon the device (the flag also acceptsfile:PATHto read the key from a file). - Install and enroll in one step: set
LOCAI_FLEET_KEYin the environment before running the headless install command, and the device enrolls itself — keys are read from the environment only, never passed on a command line:
LOCAI_FLEET_KEY=YOUR_FLEET_KEY curl -fsSL https://get.locai.co.uk/install.sh | sh
On Windows, set the environment variable in PowerShell before running irm https://get.locai.co.uk/install.ps1 | iex. See Register a Device for the install commands and what they do.
Agent Version Spread
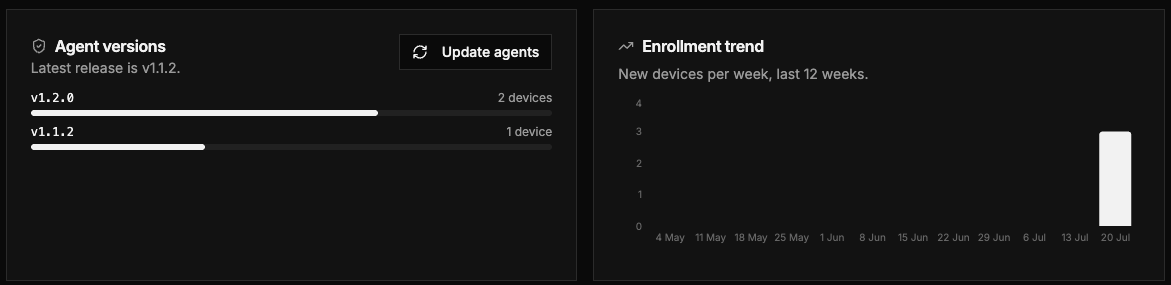
The Enrollment & config tab includes an Agent versions card showing the distribution of agent versions across your fleet (with the latest release noted), and an Enrollment trend chart displaying new device enrollments per week over the last 12 weeks (weeks start on Monday).
Use these to identify devices running older agent versions and to track fleet growth over time.
ROI Forecast Calculator
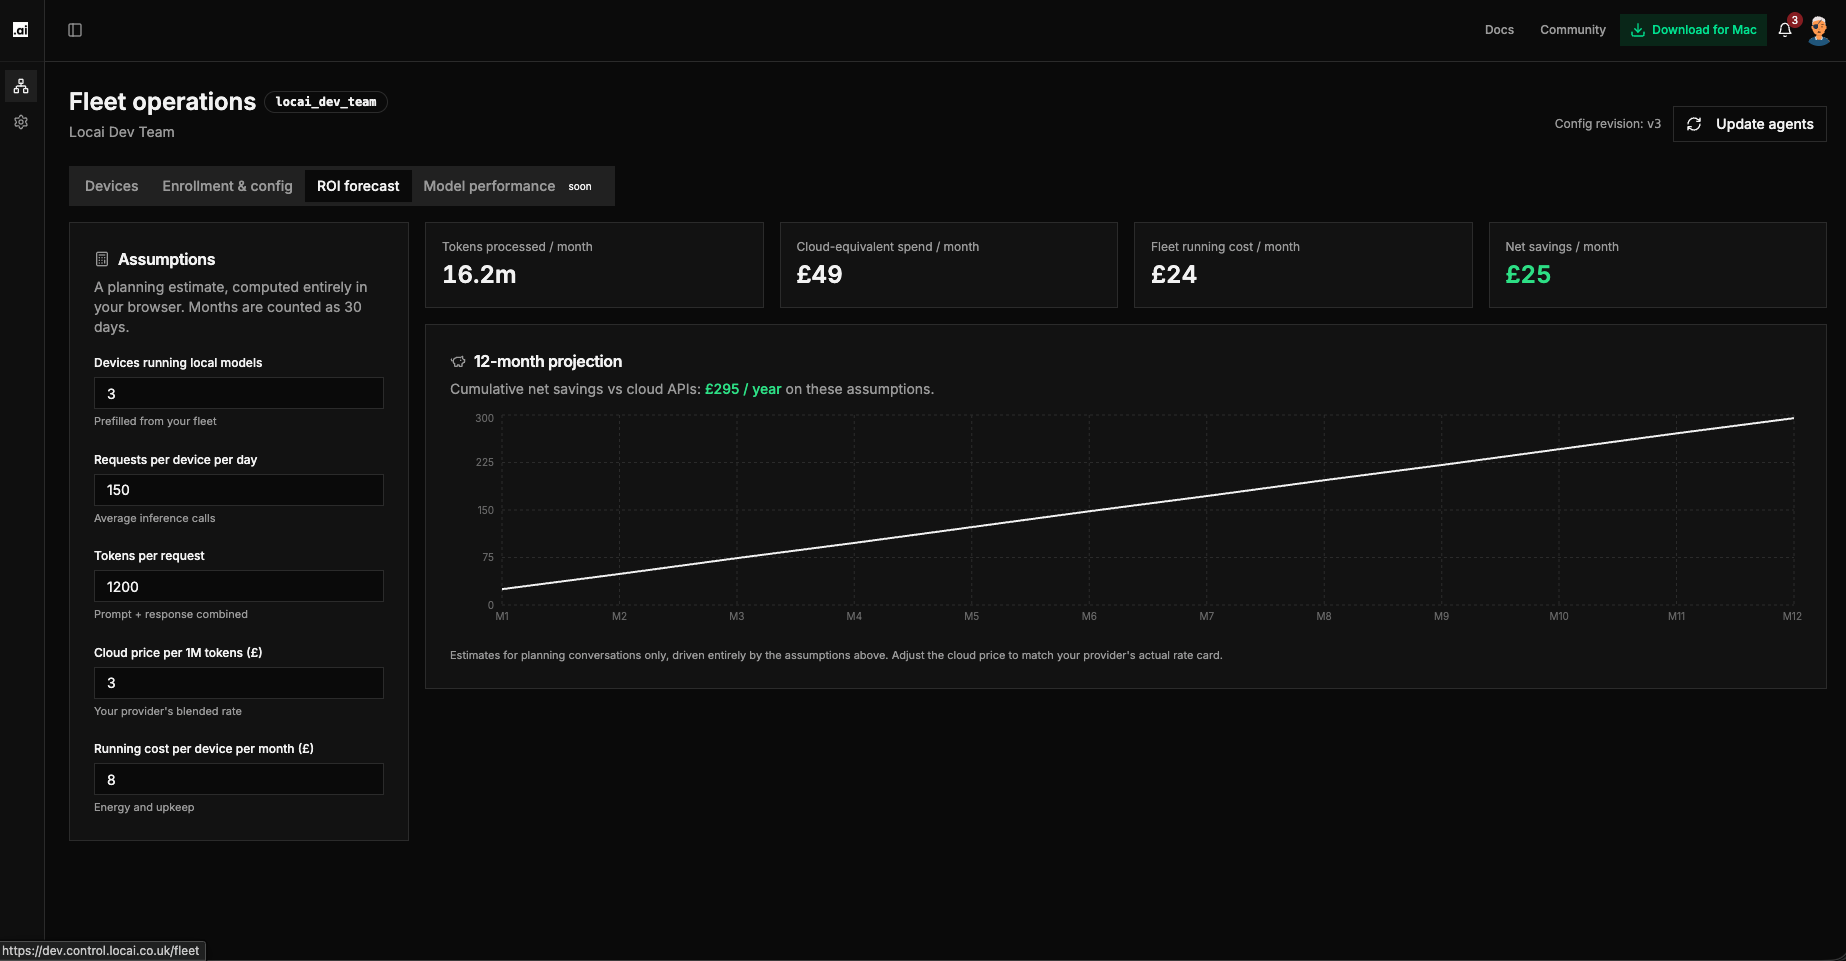
The ROI Forecast calculator helps you estimate the cost savings from running AI models locally on your fleet devices versus using cloud inference.
All calculations run in your browser; no data is sent to our servers. It is a planning estimate, with months counted as 30 days.
Inputs
| Field | Default | Description |
|---|---|---|
| Devices running local models | Prefilled from your fleet | Number of devices running models locally |
| Requests per device per day | 150 | Average daily inference requests per device |
| Tokens per request | 1,200 | Average token count per request (prompt and response combined) |
| Cloud price per 1M tokens | £3 | Your cloud provider's blended rate |
| Running cost per device per month | £8 | Energy and upkeep per device |
Adjust any input to see updated results immediately.
Outputs
- Monthly summary tiles. Tokens processed per month, cloud-equivalent spend, fleet running cost, and net savings per month.
- 12-month projection. A chart of projected cumulative net savings versus cloud APIs over the next 12 months, with the annual figure called out.
Model Performance Tab
The Model Performance tab shows fleet readiness for each model. Latency and throughput metrics are coming soon and will appear here in a future update.